
Introduction: Unlocking Insights with Modern Visual Tools
Data visualization transforms complex data into easy-to-understand visual formats, helping us spot trends, patterns, and outliers quickly. With the explosion of big data and advanced technologies, next-generation data visualization techniques are evolving to offer more interactive, immersive, and insightful ways to explore data.
This blog explains what next-generation data visualization means, why it’s important, real-world uses, basic working concepts, challenges, and what the future holds for this dynamic field.
AI-Powered Creativity and Content Generation
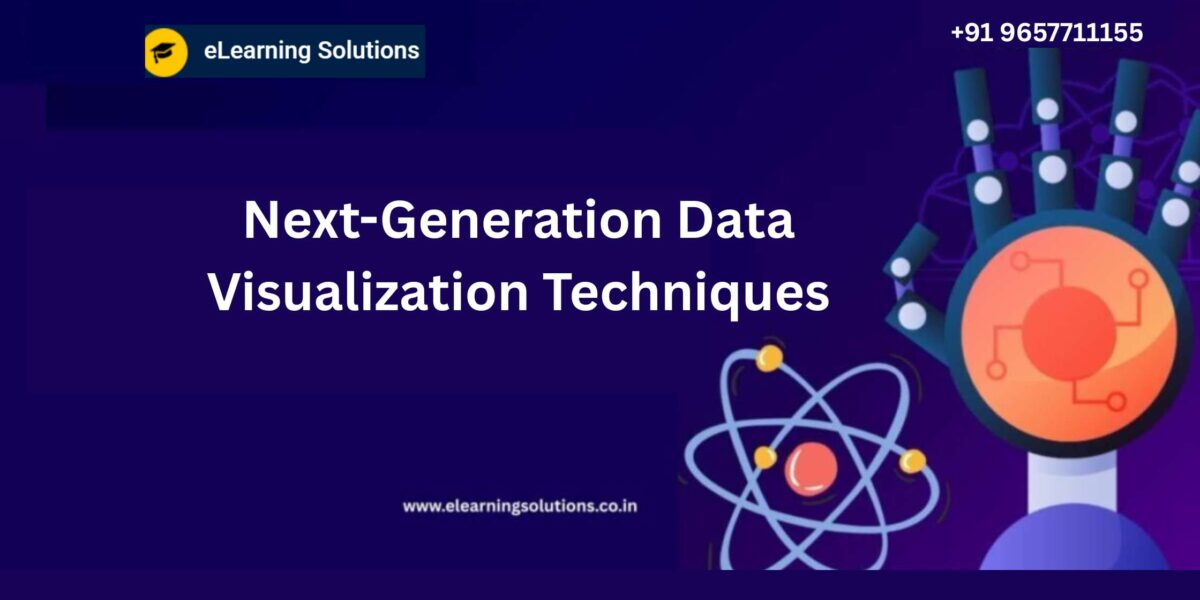
What Are Next-Generation Data Visualization Techniques?
Next-generation data visualization goes beyond traditional charts and graphs. It includes advanced methods like 3D visualization, virtual reality (VR), augmented reality (AR), interactive dashboards, and AI-driven visual analytics. These techniques enhance user experience and make data exploration more intuitive and impactful.
Why Next-Generation Data Visualization Matters
- Improved Understanding: Complex datasets become clearer through interactive visuals.
- Faster Decision Making: Dynamic tools allow quicker insight generation.
- Engagement: Interactive and immersive visuals keep users more engaged.
- Accessibility: Makes data insights available to non-technical users.
- Customization: Enables tailored views to suit different needs or roles.
These benefits make data-driven decisions more accurate and efficient.
Real-World Applications of Next-Generation Visualization
1. Business Intelligence
Companies use interactive dashboards with real-time data updates to monitor performance and market trends.
2. Healthcare
3D imaging and VR help doctors visualize anatomy or patient data for better diagnosis and treatment planning.
3. Education
Augmented reality tools enable immersive learning experiences, making abstract concepts easier to grasp.
4. Urban Planning
City planners use geographic information systems (GIS) with layered visualizations for infrastructure development.
5. Finance
AI-powered visualization tools analyze stock market trends with predictive insights.
How Next-Generation Visualization Techniques Work (Simplified)
- Data Collection: Gathering data from various sources including IoT devices, databases, and APIs.
- Data Processing: Cleaning and transforming data into formats suitable for visualization.
- Visualization Engine: Using software or AI algorithms to generate visual outputs.
- User Interaction: Providing tools for users to manipulate, zoom, filter, or explore visuals dynamically.
This process helps convert raw data into actionable visual stories.
Challenges and Limitations
- Data Quality: Poor data affects visualization accuracy.
- Technical Complexity: Advanced tools require skills to design and maintain.
- Cost: High-end visualization setups can be expensive.
- Overload: Too much information can overwhelm users.
- Accessibility: Some advanced visuals may not be accessible to all users.
Addressing these issues is key to effective deployment.
The Future of Data Visualization
Next-generation visualization will increasingly integrate AI, machine learning, and immersive technologies. Expect smarter, adaptive visuals that guide users automatically and blend seamlessly into daily workflows.
As data grows, visualization will remain vital for making sense of information, driving innovation, and improving communication.
you may be interested in this blog here:-
Don’t Fear the Update: Navigating the Challenges of how to implement sap note
Five Top Technology Investment Drivers for 2024
How many dollars worth of RSU does Salesforce typically offer an MTS (experienced hire) on joining?
Integration cloud system to HANA Cloud Platform using Cloud Connector
Find Your Preferred Courses
SAP SD S4 HANA
SAP HR HCM
Salesforce Administrator Training
Salesforce Developer Training
SAP EWM
Oracle PL-SQL Training Program
Pega Training Courses in Pune- Get Certified Now
SAP PP (Production Planning) Training Institute


